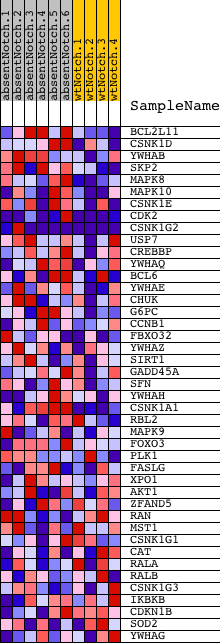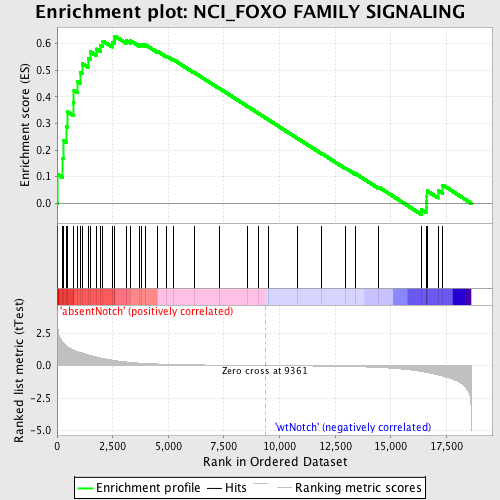
Profile of the Running ES Score & Positions of GeneSet Members on the Rank Ordered List
| Dataset | Set_03_absentNotch_versus_wtNotch.phenotype_absentNotch_versus_wtNotch.cls #absentNotch_versus_wtNotch.phenotype_absentNotch_versus_wtNotch.cls #absentNotch_versus_wtNotch_repos |
| Phenotype | phenotype_absentNotch_versus_wtNotch.cls#absentNotch_versus_wtNotch_repos |
| Upregulated in class | absentNotch |
| GeneSet | NCI_FOXO FAMILY SIGNALING |
| Enrichment Score (ES) | 0.62737983 |
| Normalized Enrichment Score (NES) | 1.55596 |
| Nominal p-value | 0.010657194 |
| FDR q-value | 0.7875487 |
| FWER p-Value | 0.986 |
| PROBE | DESCRIPTION (from dataset) | GENE SYMBOL | GENE_TITLE | RANK IN GENE LIST | RANK METRIC SCORE | RUNNING ES | CORE ENRICHMENT | |
|---|---|---|---|---|---|---|---|---|
| 1 | BCL2L11 | 780044 4200601 | 37 | 2.778 | 0.1081 | Yes | ||
| 2 | CSNK1D | 4280280 4480167 6450600 | 242 | 1.818 | 0.1692 | Yes | ||
| 3 | YWHAB | 1740176 | 277 | 1.729 | 0.2359 | Yes | ||
| 4 | SKP2 | 360711 380093 4810368 | 425 | 1.508 | 0.2877 | Yes | ||
| 5 | MAPK8 | 2640195 | 461 | 1.464 | 0.3438 | Yes | ||
| 6 | MAPK10 | 6110193 | 723 | 1.219 | 0.3781 | Yes | ||
| 7 | CSNK1E | 2850347 5050093 6110301 | 757 | 1.190 | 0.4235 | Yes | ||
| 8 | CDK2 | 130484 2260301 4010088 5050110 | 922 | 1.068 | 0.4570 | Yes | ||
| 9 | CSNK1G2 | 3060095 4730037 | 1033 | 1.004 | 0.4909 | Yes | ||
| 10 | USP7 | 3990356 | 1123 | 0.976 | 0.5248 | Yes | ||
| 11 | CREBBP | 5690035 7040050 | 1393 | 0.828 | 0.5431 | Yes | ||
| 12 | YWHAQ | 6760524 | 1483 | 0.782 | 0.5693 | Yes | ||
| 13 | BCL6 | 940100 | 1780 | 0.649 | 0.5791 | Yes | ||
| 14 | YWHAE | 5310435 | 1965 | 0.579 | 0.5921 | Yes | ||
| 15 | CHUK | 7050736 | 2060 | 0.548 | 0.6088 | Yes | ||
| 16 | G6PC | 430093 | 2475 | 0.416 | 0.6030 | Yes | ||
| 17 | CCNB1 | 4590433 4780372 | 2562 | 0.395 | 0.6140 | Yes | ||
| 18 | FBXO32 | 110037 610750 | 2599 | 0.387 | 0.6274 | Yes | ||
| 19 | YWHAZ | 1230717 | 3122 | 0.271 | 0.6100 | No | ||
| 20 | SIRT1 | 1190731 | 3302 | 0.239 | 0.6099 | No | ||
| 21 | GADD45A | 2900717 | 3704 | 0.188 | 0.5957 | No | ||
| 22 | SFN | 6290301 7510608 | 3809 | 0.174 | 0.5970 | No | ||
| 23 | YWHAH | 1660133 2810053 | 3968 | 0.161 | 0.5949 | No | ||
| 24 | CSNK1A1 | 2340427 | 4506 | 0.119 | 0.5707 | No | ||
| 25 | RBL2 | 580446 1400670 | 4918 | 0.097 | 0.5525 | No | ||
| 26 | MAPK9 | 2060273 3780209 4070397 | 5224 | 0.084 | 0.5394 | No | ||
| 27 | FOXO3 | 2510484 4480451 | 6163 | 0.054 | 0.4910 | No | ||
| 28 | PLK1 | 1780369 2640121 | 7287 | 0.031 | 0.4318 | No | ||
| 29 | FASLG | 2810044 | 8569 | 0.011 | 0.3633 | No | ||
| 30 | XPO1 | 540707 | 9072 | 0.004 | 0.3364 | No | ||
| 31 | AKT1 | 5290746 | 9501 | -0.002 | 0.3134 | No | ||
| 32 | ZFAND5 | 6770673 | 10809 | -0.021 | 0.2439 | No | ||
| 33 | RAN | 2260446 4590647 | 11905 | -0.041 | 0.1865 | No | ||
| 34 | MST1 | 1400403 | 12963 | -0.069 | 0.1324 | No | ||
| 35 | CSNK1G1 | 840082 1230575 3940647 | 13392 | -0.086 | 0.1127 | No | ||
| 36 | CAT | 4280152 | 14463 | -0.148 | 0.0610 | No | ||
| 37 | RALA | 2680471 | 16372 | -0.459 | -0.0236 | No | ||
| 38 | RALB | 6130397 | 16590 | -0.524 | -0.0145 | No | ||
| 39 | CSNK1G3 | 110450 | 16595 | -0.525 | 0.0061 | No | ||
| 40 | IKBKB | 6840072 | 16623 | -0.532 | 0.0257 | No | ||
| 41 | CDKN1B | 3800025 6450044 | 16626 | -0.533 | 0.0467 | No | ||
| 42 | SOD2 | 1410053 | 17123 | -0.717 | 0.0485 | No | ||
| 43 | YWHAG | 3780341 | 17341 | -0.804 | 0.0686 | No |